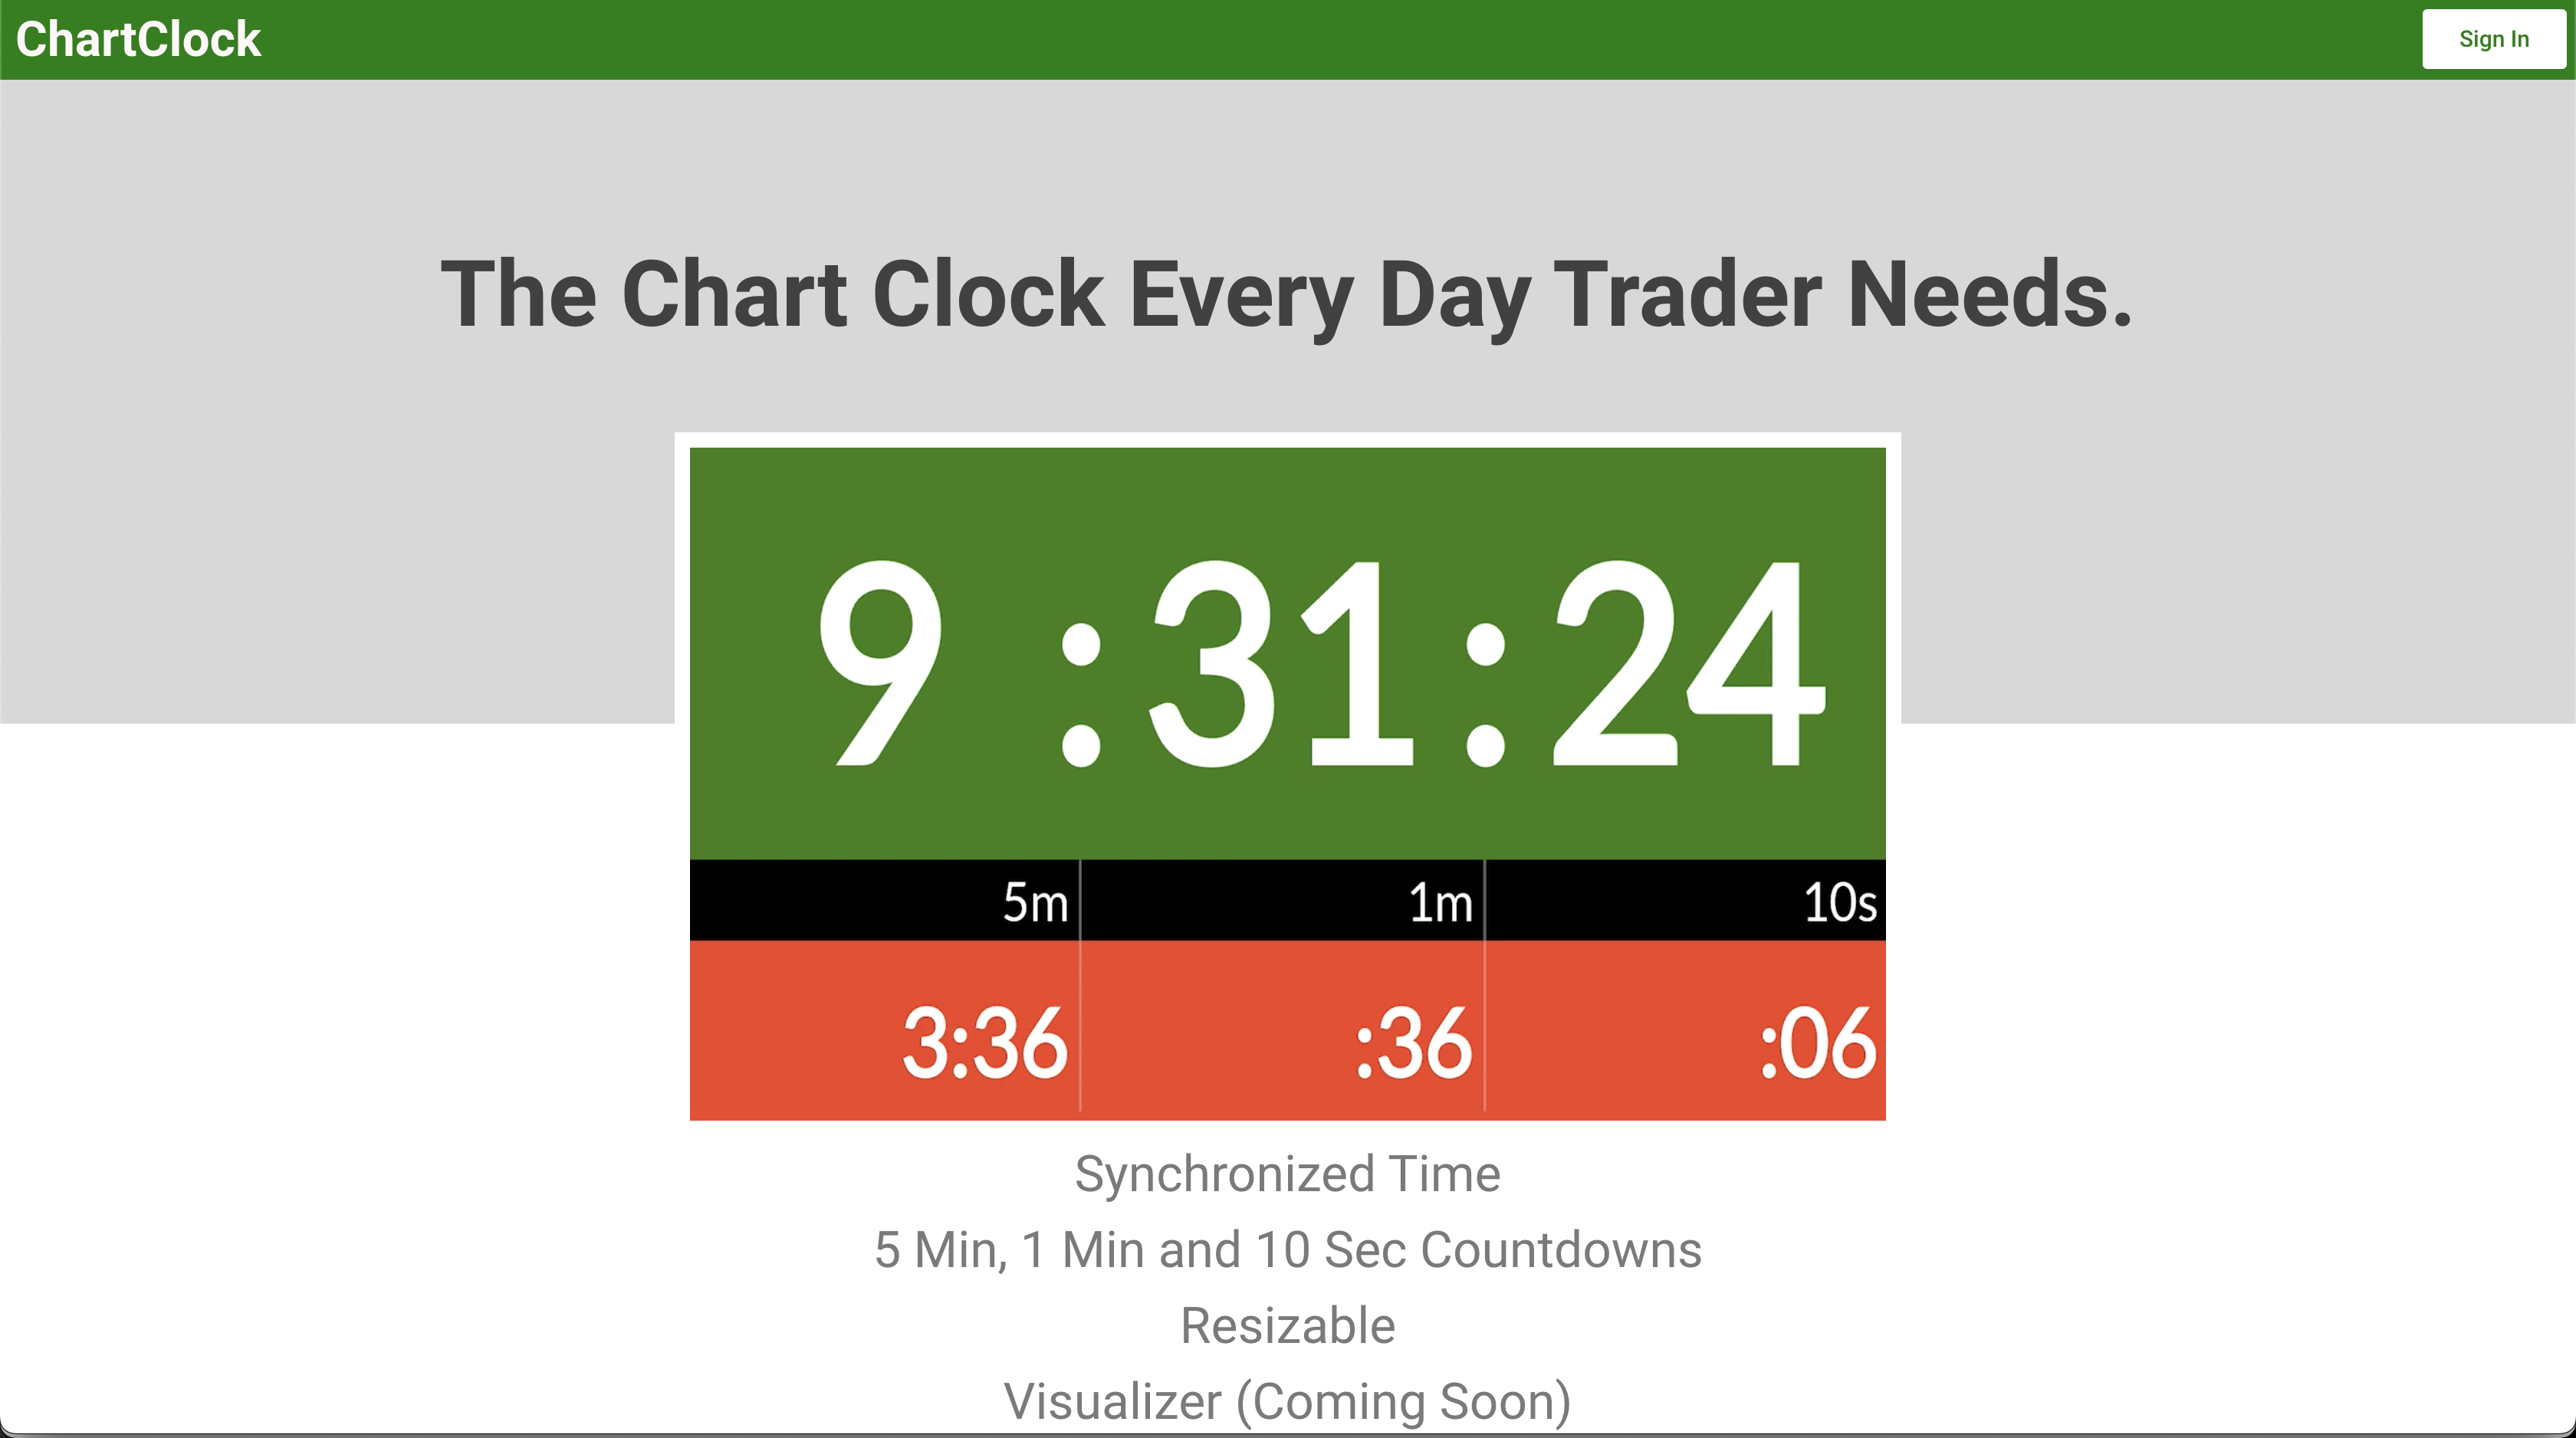
As a day trader, it's essential to have the right information, in the right place, at the right time. The time is crucial to reading stock chart timeframes.
I've used multiple platforms and realized all of them failed in this area. Some platforms may allow you to adjust font size, or change location, while others don't allow any customization at all. Generally, you'll end up with a basic clock in a random screen location that is to small to read quickly when executing trades.
Additionally, it's important to know how much time is left in each timeframe and candle. However, clocks count up. I needed a synchronized clock AND countdown timer. Most importantly, it needed to be synchronized, to the second, with Eastern Standard Time (EST), which is the NYSE stock market timezone.
After an extensive search turned up no solutions, Chartclock was born.
Why are charts and timeframes important in day trading?
Charts and timeframes are crucial for day traders because they provide essential information to help traders make informed decisions about when to enter and exit trades.
Charts display the price movements of an asset over time, allowing traders to analyze patterns and trends in the market. By studying charts, day traders can identify key levels of support and resistance, as well as potential entry and exit points for trades.
Timeframes, on the other hand, refer to the length of time that each bar or candle on the chart represents. Different timeframes provide different levels of detail about price movements. For example, a 5-minute chart provides more detail about price movements than a 1-hour chart. Day traders typically use short-term timeframes, such as 1-minute or 5-minute charts, to identify short-term trends and make quick trading decisions.
By using charts and timeframes, day traders can gain a better understanding of market movements and make more informed decisions about when to buy and sell assets.
What does the clock tell a trader?
The clock time tells a trader when each candle or bar on a chart begins and ends, allowing them to align their chosen timeframe with the market's activity. This is critical in helping traders make informed decisions about when to enter or exit trades.
For example, if a trader is using a 5-minute chart, each candle on the chart represents a 5-minute period. The trader needs to be aware of when each 5-minute period starts and ends in relation to the market's open and close times. This information allows them to accurately interpret the movements on the chart and make more informed trading decisions.
Additionally, the clock time can also help traders identify specific time periods when the market is likely to be more active or less active, depending on the trading session or time zone. This can help traders choose an appropriate timeframe and chart type to use for their analysis.
What is Chartclock?
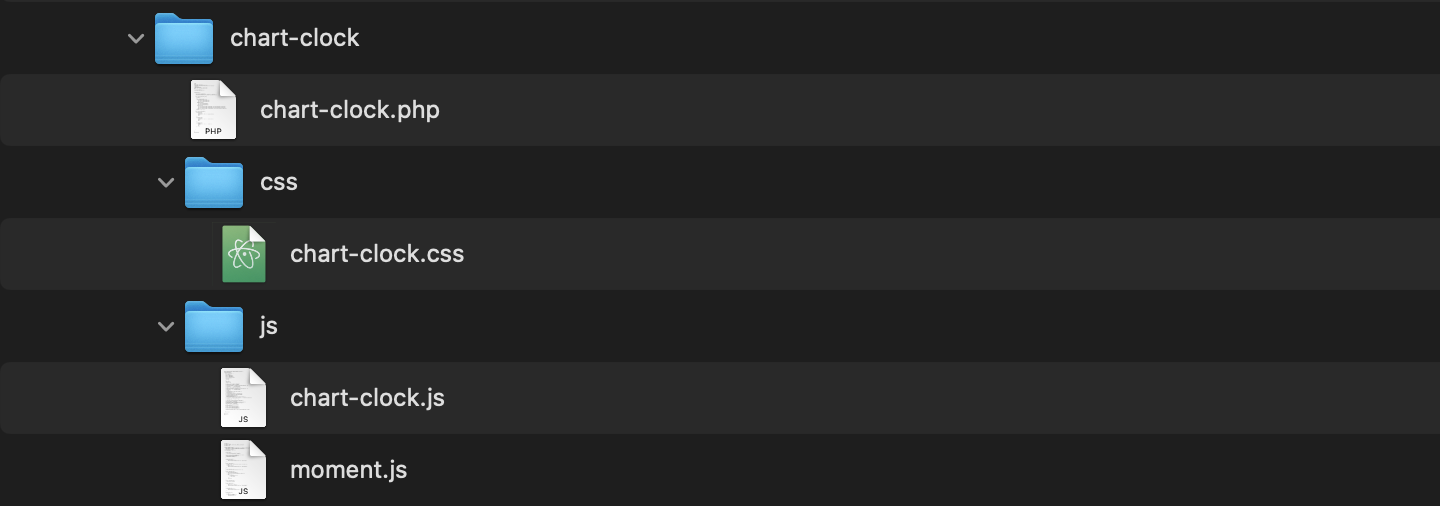
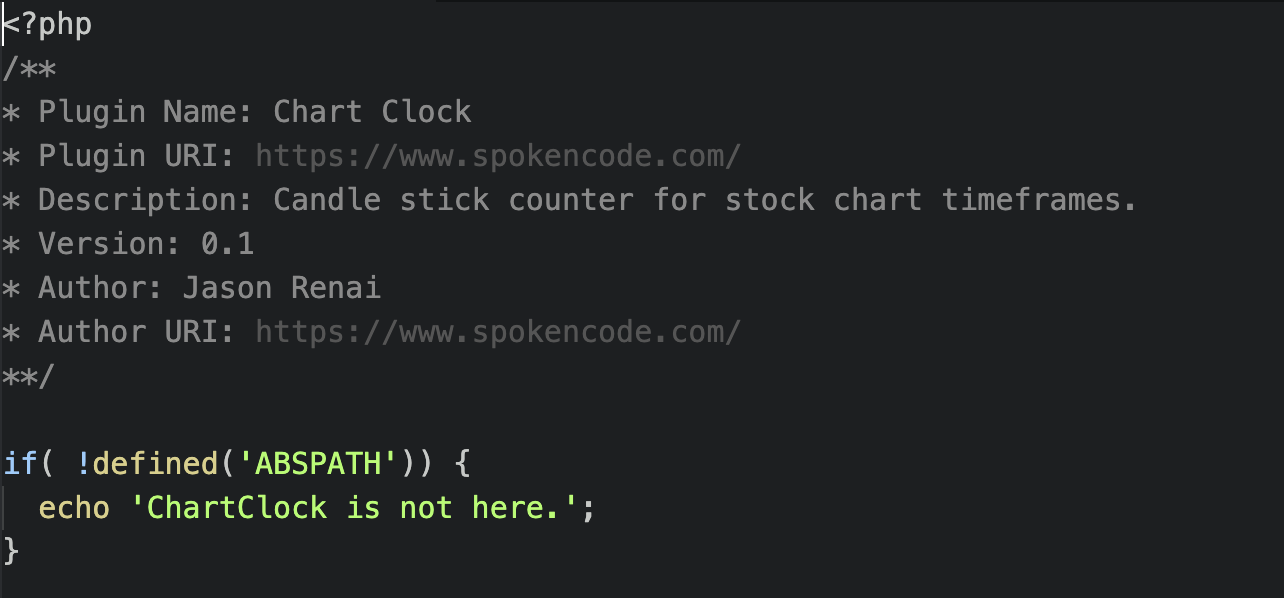
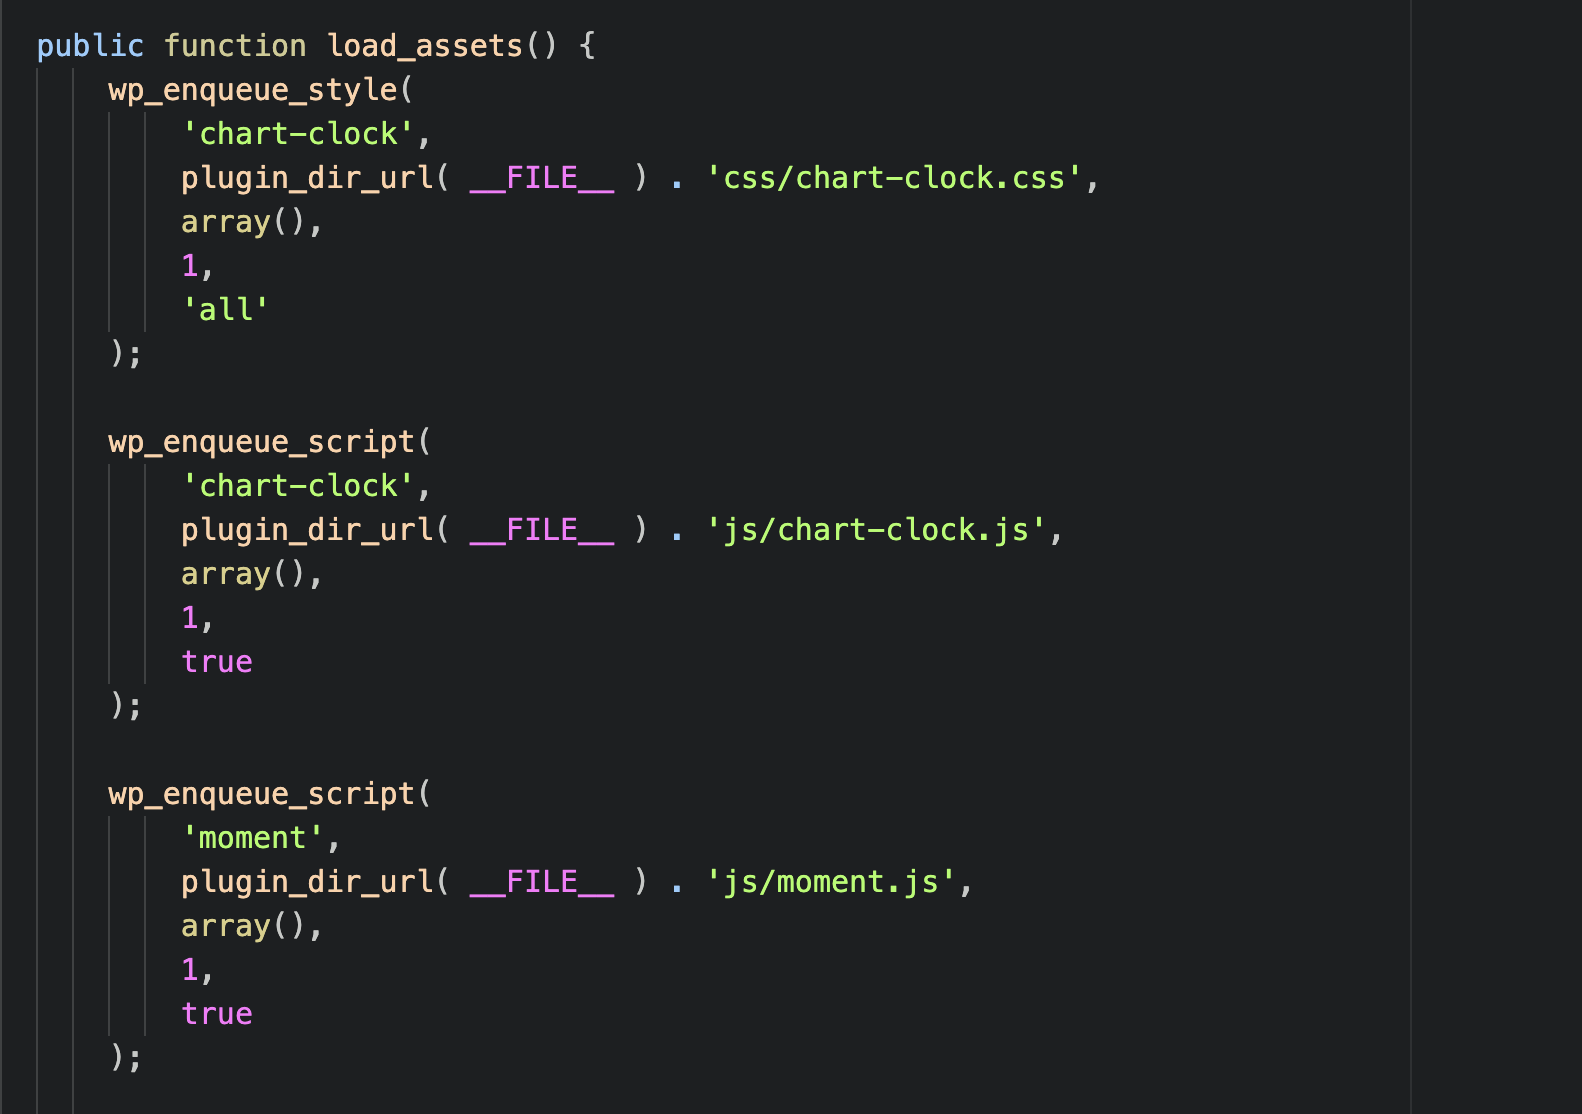
Chartclock solves the most basic problem of all trading platforms; lack of a clock that not only tells standard time, but tells candle time. Chartclock is a custom built, ChatGPT-assisted Wordpress plugin that can be installed on any Wordpress site. The plugin uses Moment.js to get the current time and then performs time calculations to "countdown" the time remaining in 5 minute, 1 minute and 10 second time frames. Chartclock.com is a membership site built with PaidMembershipsPro and using the Chartclock plugin.
The product roadmap includes implementing a visual counter using a charting plugin for Wordpress and building on Electron.js for both web-based and downloadable, native app support.
Chartclock Wordpress Plugin
Chartclock is a Wordpress plugin written in Javascript that renders a responsive countdown clock on any page using a shortcode.
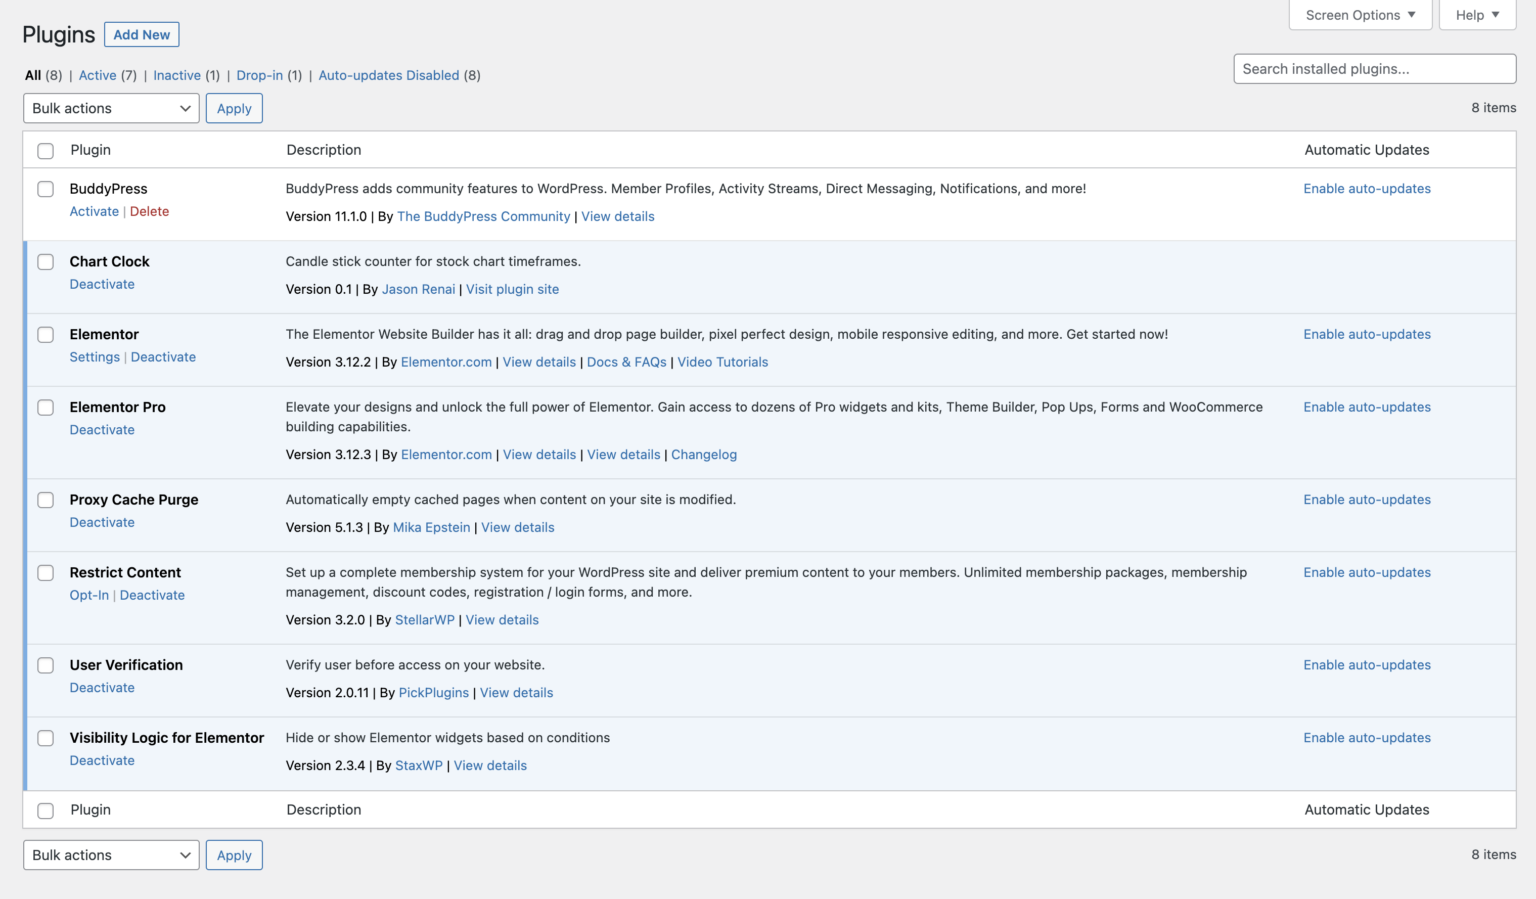

Chartclock Wordpress Plugin
Chartclock is a Wordpress plugin written in Javascript that renders a responsive countdown clock on any page using a shortcode.
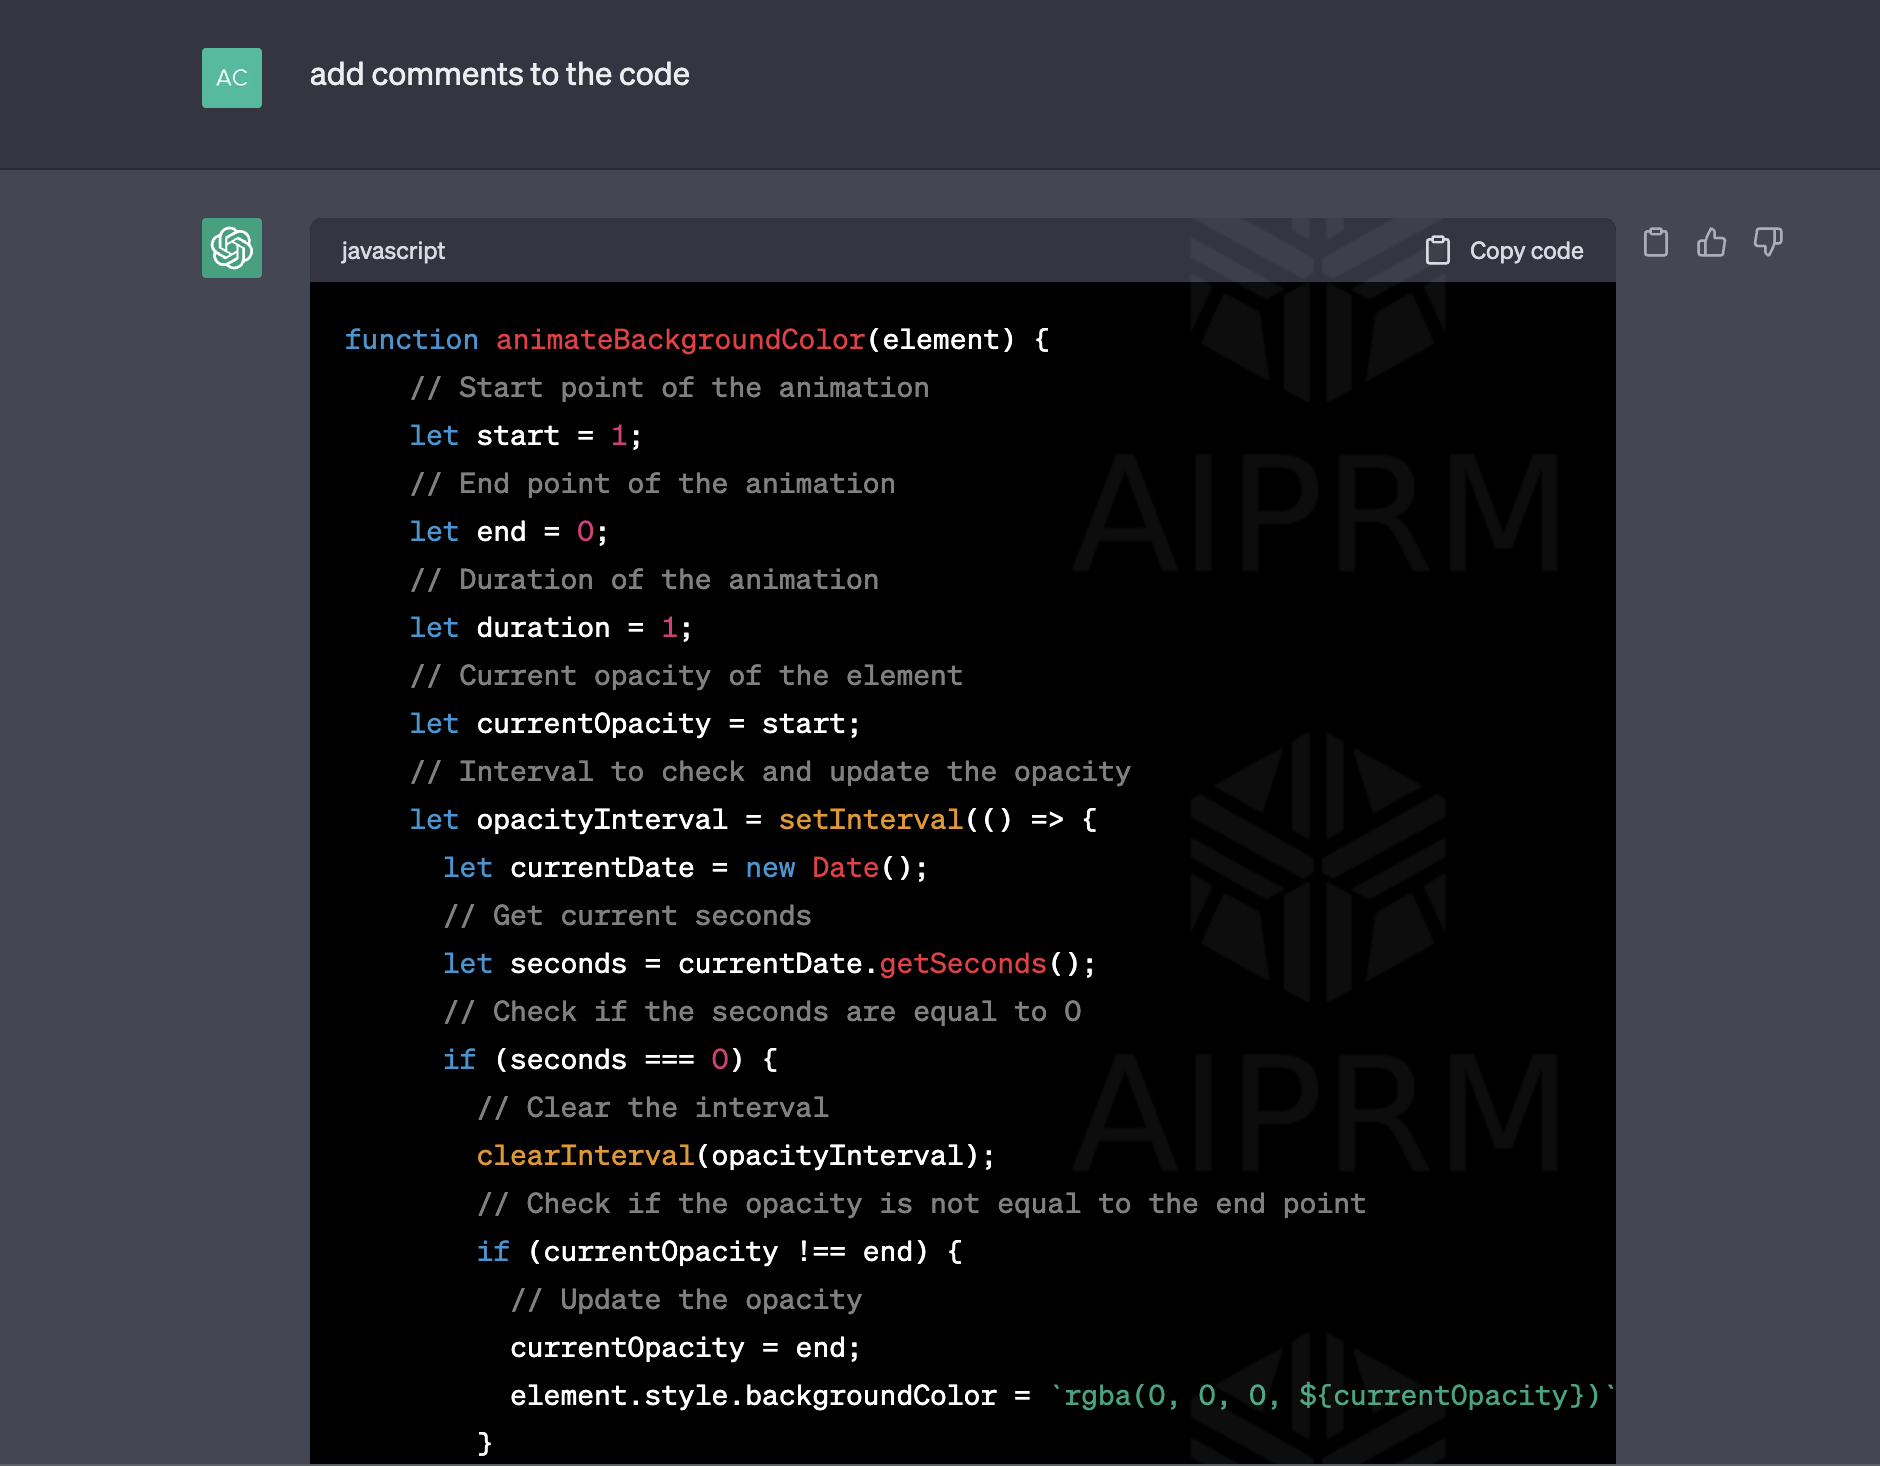
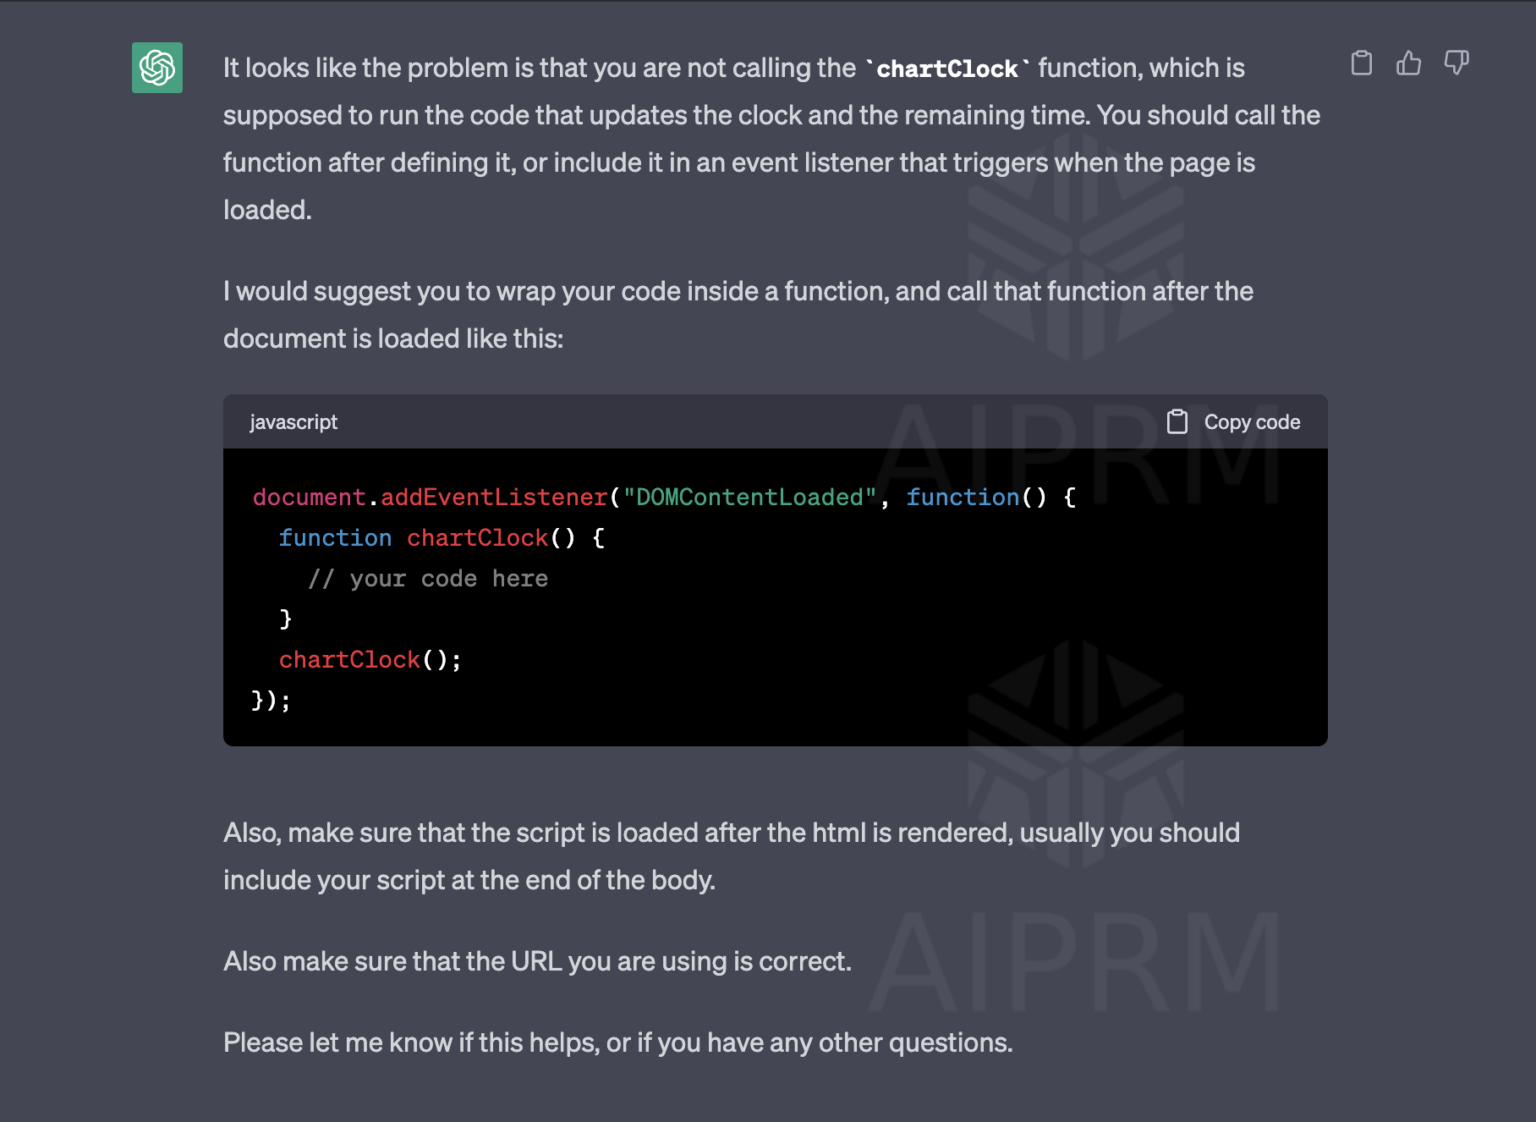
Since Chat GPT isn't doesn't interact with your apps, the code it writes is independent of your app and needs to be included. While the code always works in my experience, integrating the code can cause some problems that ChatCPT can even troubleshoot.
